Early this morning, I was a Total Beginner to gnuplot (
http://www.gnuplot.info/), but now I am happy to tell you that I have advanced to the state of simple Beginner. As shown on the home page link above, you can plot pretty much any data set with gnuplot and do it quite prettily. But gnuplot is not the easiest program to get started with and the documentation is pretty cryptic, so I thought I'd share with you what I learned about it via a specific task.
The TaskI wanted to plot the minute by minute HTTP connection data from a web caching server. The connection counts are generated by the output of "netstat -na grep ESTABLISHED" and stored in a simple text file. There is a bit more to that script, but for now, I will limit this discussion to how to get a simple chart out of gnuplot.
A word about caching web servers. As implied by the word "cache", a caching web server stores copies of web pages from an origin web server in order to alleviate the load off that origin server. Upon the first request for a web page, the caching server requests the page from the origin web server and stores that page in memory or on disk. The cache can then fulfill any subsequent client requests for the same page, thus taking the hit and alleviating the load of the request off of the origin server.
Since a caching server functions as an intermediary (proxy) server, I am interested in plotting both the connections from the client browser to the caching server, as well as the connections from the caching server to the origin web server on the backend.
The content of the text file looks like this:
20070727151200 215 210 520070727151259 191 186 520070727151401 207 201 620070727151500 186 180 620070727151600 165 156 920070727151700 167 161 620070727151801 182 174 820070727151900 197 190 720070727152001 197 191 620070727152100 187 181 6* The first column is date/time stamp.
* The second column is total HTTP connections.
* The third column is HTTP connections from the client browser to the cache.
* The last column is HTTP connections back to the origin server.
As you can see from this small amount of data, it looks like the cache handles roughly 97% of the requests for the web site and 3% are directed back to the origin servers.
So let's make a nice graph of this data, dammit!
Install gnuplotIf you're on Fedora, "
yum install gnuplot" will do the trick. On Debian, "
apt-get install gnuplot gnuplot-doc" should do it for you. Otherwise, download the source from
http://www.gnuplot.info/ and you'll be off and running.
You can run gnuplot interactively or via command shell. For the purpose of this discussion, I will discuss the interactive interface for gnuplot. Once the software is installed, type "
gnuplot" to start the program:
[root@computer ~]# gnuplot
gnuplot>
Getting HelpIf you type "help" at the prompt, you'll get a list of help topics available:
Help topics available:
    batch/interactive bugs              commands          comments
    coordinates       copyright         environment       expressions
    glossary          graphical         help-desk         introduction
    line-editing      mouse             new-features      old_bugs
    plotting          set               show              startup
    substitution      syntax            time/date
To get information about a particular topic, simply type "help <topicname>" like so:
Help topic: plotting
 There are three `gnuplot` commands which actually create a plot: `plot`,
 `splot` and `replot`.  `plot` generates 2-d plots, `splot` generates 3-d
 plots (actually 2-d projections, of course), and `replot` appends its
...
You can press the return key for more text and if you're at a "Subtopic of.." menu, you can get a list of available options by typing a question mark, like so:
Subtopic of plotting: ?
Subtopics available for plotting:
    styles
My First Plot!The easiest thing I did is try a test plot of some data. I typed the following:
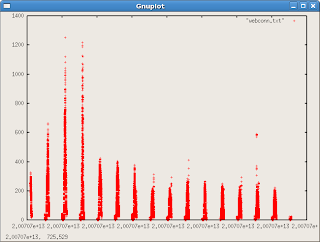
gnuplot> plot 'webconn.txt'
This gave me a rather ugly plot of the first column of data using red crosshairs for every observation:
I learned a bit about customizing my plots from here:
http://www.duke.edu/~hpgavin/gnuplot.htmlAnd here:
http://www.gnuplot.info/docs_4.0/gpcard.pdfLet's Get FancyI didn't like the red crosshairs, so I found an option to change the graph to a line graph:
gnuplot> plot 'webconn.txt' with lines
And then a more advanced graph specifying the exact columns for use (the x and y axes) with the "using" parameter. I also threw in the axis title for good measure:
gnuplot> plot 'webconn.txt' using 1:3 title "HTTP_WEB" with lines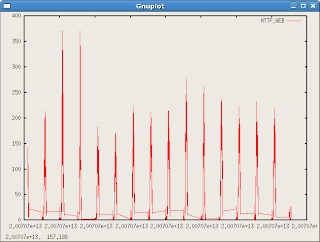
And finally, multiple data columns:
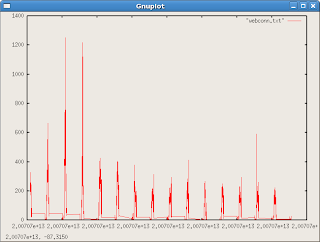
gnuplot> plot 'webconn.txt' using 1:3 title "HTTP_WEB" with lines,'webconn.txt' using 1:4 title "HTTP_OWS" with lines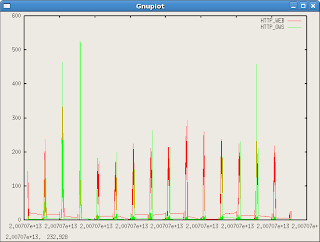
You can also shorten the syntax of the command by typing "u" for "using", "w" for "with", "t" for "title" and "l" for lines, like so:
gnuplot> plot 'webconn.txt' u 1:3 t "HTTP_WEB" w l,'webconn.txt' u 1:4 t "HTTP_OWS" w lThe Plot ThickensOooh. Getting somewhat cryptic now, eh? But something is wrong with the data in the graph. Why does it have these strange lines every so often?
After digging through my data, I saw that these ugly, flat lines occurred at each change in the day. Oh! gnuplot is interpreting the date/time string as a number! At the change of the day, the hour jumps from 200707212359 to 200707220000. Numerically, this is a jump of 7641 (220000-212359). I needed to make gnuplot think my xaxis is a date format. I found the solution with a combination of the following commands:
set xdata time - this sets the data format of the xaxis to a time format
set timefmt "%Y%m%d%H%M%S" - this sets the time format to match the timestamp in my data file
Once I set these two parameters, I got quite a lovely graph using the last command:
gnuplot> plot 'webconn.txt' u 1:3 t "HTTP_WEB" w l,'webconn.txt' u 1:4 t "HTTP_OWS" w l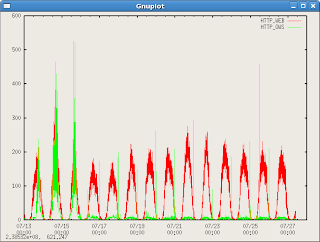
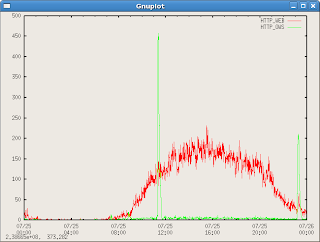
Finally, I wanted to zoom into a specific day. There was another nice command I found:
set xrange ["200707250000":"200707260000"]This made searching on a specific day very easy!
I hope you enjoyed this short tutorial. I will endeavour to add more information as I learn more about this exciting tool.
Reference
Great examples hereinCheers!
Cacasodo


