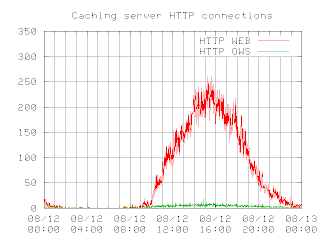
I will expand upon that posts' themes and give you a simple script that will output a nice PNG graphic of a data set without having to use gnuplot interactively.
As in the previous post, my goal is to plot HTTP connections. I want the script to generate the graph for the previous days' activity. Should be simple enough!
As review, my data file looks like this:
20070727151200 215 210 5
20070727151259 191 186 5
20070727151401 207 201 6
20070727151500 186 180 6
20070727151600 165 156 9
20070727151700 167 161 6
20070727151801 182 174 8
20070727151900 197 190 7
20070727152001 197 191 6
20070727152100 187 181 6
* The first column is date/time stamp.
* The second column is total HTTP connections.
* The third column is HTTP connections from the client browser to the cache.
* The last column is HTTP connections back to the origin server.
Here is the script:
!#/bin/bash
TITLE="Caching server HTTP connections"
TODAY="`date +%Y%m%d`000000"
YESTERDAY="`date +%Y%m%d --date="-1 day"`000000"
YMAX=350
gnuplot -noraise <<-finis
set xdata time
set timefmt "%Y%m%d%H%M%S"
set yrange [0:$YMAX]
set ytics 50
set bmargin 3
set grid xtics mxtics ytics
set title "$TITLE"
set xrange ["$YESTERDAY":"$TODAY"]
set term png medium
set output "webconn.png"
plot 'webconn.txt' using 1:3 title "HTTP_WEB" with lines,\
'webconn.txt' using 1:4 title "HTTP_OWS" with lines
finis
You can see I have a few constants up top that set a title and the date range. Note the neat little "date -1" trick in the date command for the YESTERDAY constant. That has come in handy more than once!
I then set a maximum value for the Y axis.
Using the -noraise switch tells gnuplot to not raise the graph window. Next, I use the input redirector (<<) to feed in parameters to gnuplot. The "-finis" is simply a label to the input that I call at the beginning and the end of my input. I then feed in as many parameters as I need. When I am done, I just call "finis" without the hyphen and this turns off the input.
You can see I feed in a lot of the parameters that I had to manually enter during the last post regarding interactive gnuplot. I've thrown a few more in with this example:
set yrange sets the maximum range of the y axis
set ytics sets the spacing of the bars in the y axis
set bmargin sets the spacing of the bottom margin in pixels
set grid xtics mxtics ytics sets your grid preferences
set term sets the output type; in this case, a medium sized png graphic
set output specifies the name of the file
The rest of the commands you already know from my first post on the subject. At the end of all the parameters I set, I make sure to close the input by entering the keyword "finis" that I defined at the beginning of the input redirection. You can use any non-shell script word for the keyword. I just chose "finis" because it means "The End" and has no other special meaning to the Unix shell.
Finally, here is the lovely output:

Hope you liked it!
'sodo
2 comments:
If only I had found this a week ago
Isn't it always the way, though?
:)
Post a Comment